How Much Is a Home Really Worth? The Problem with Numbers That Seem Certain
How Much Is a Home Really Worth? The Problem with Numbers That Seem CertainPrice per square metre, online estimates, market statistics and automated valuations. The property market is increasingly described through precise figures. But how comparable is the information behind them?
We have never had so much information about the property market at our fingertips. A few clicks are enough to discover the average asking price in a neighbourhood, compare properties apparently similar to our own or obtain an estimated value for a home without anyone ever stepping through its front door.
The figures are often remarkably precise. Prices are expressed down to the last euro, variations are calculated to a decimal point, and estimates appear within carefully defined ranges. This precision is reassuring. It gives us the impression that the property market can be measured with the same certainty as the temperature outside.
Yet there is a fundamental question that is rarely asked: what, exactly, are those numbers measuring?
Because an asking price is not a selling price. An average is not necessarily representative of an individual property. And two figures expressed in euros per square metre may be based on entirely different ways of calculating floor area.
Understanding these distinctions does not mean rejecting market data. It means learning to read it properly.
The notification many of us recogniseHow many times have you received a notification telling you that the price of a property you were following has been reduced?
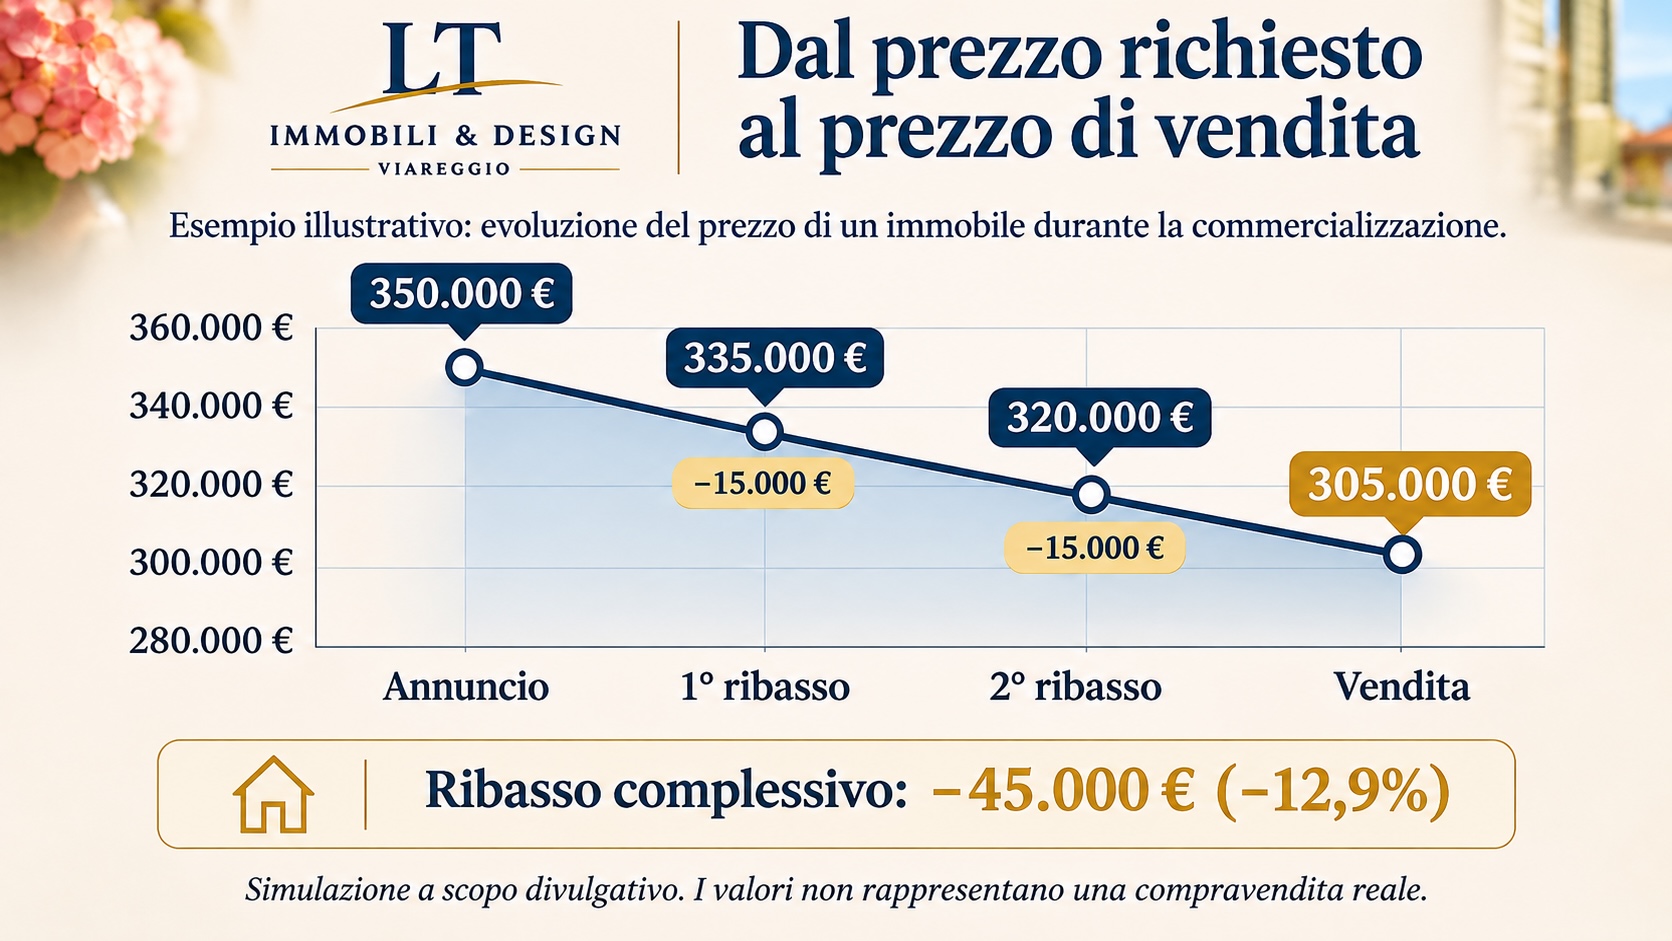
Perhaps a home was initially advertised at €350,000. A few weeks later, the asking price dropped to €335,000. After another period on the market, it was reduced again to €320,000.
For someone following the listing, those changes tell a story. The seller may be reconsidering their expectations, the property may be attracting less interest than anticipated, or the original price may simply have been too ambitious.
But there is one piece of information that the listing cannot necessarily reveal: the price at which the property will eventually sell.
Suppose the transaction is ultimately agreed at €305,000. The difference between the original asking price and the final selling price would be €45,000, or approximately 12.9%.
The example is hypothetical, but it illustrates a very real distinction. Advertised prices describe what sellers hope to obtain. Completed transactions tell us what buyers have actually agreed to pay.
Both figures are useful, but they answer different questions.
This is also why the choice of an initial asking price deserves careful consideration, as we explored in our article How the Initial Asking Price Can Determine the Outcome of a Sale.
[GRAPHIC 1 — From Asking Price to Selling Price]
Illustrative example: €350,000 → €335,000 → €320,000 → €305,000. Overall difference: −€45,000 (−12.9%). Figures are hypothetical and do not refer to an actual transaction.
When official statistics tell a different storyThe distinction becomes even more interesting when we move from individual properties to the wider market.
Different statistical indicators can describe the same period in apparently contradictory ways. House prices may rise while the number of transactions remains almost unchanged. Asking prices may increase even when buyers are becoming more cautious. And a national trend may bear little resemblance to what is happening in a particular town or neighbourhood.
Consider the Italian residential market in the second quarter of 2026. According to preliminary figures published by ISTAT, Italy’s National Institute of Statistics, house prices increased by approximately 4% compared with the same period of the previous year. Prices for existing homes rose by around 3.7%, while the increase in central Italy was approximately 5.1%.
At the same time, residential transaction data from the Italian Revenue Agency’s Real Estate Market Observatory (OMI) indicated an almost unchanged volume of sales, with a year-on-year variation of approximately +0.1%.
The Bank of Italy’s survey of the residential property market offered yet another perspective, examining the perceptions of estate agents, demand conditions, available supply, negotiation margins and selling times.
Are these accounts inconsistent? Not necessarily.
They simply observe different aspects of the market.
A price index measures how residential property prices are changing. Transaction statistics measure how many properties are being bought and sold. Surveys of market professionals help describe the conditions under which those transactions are taking place.
The mistake is not in using these figures. It is in treating them as though they all measured the same thing.
And there is another important consideration: a national or regional average cannot automatically explain what is happening in a specific part of Viareggio, Camaiore or Pietrasanta.
Property markets are local by nature, even when the statistics used to describe them are national.
Price per square metre: a precision that can be misleadingFew figures are as widely used in property advertising as the price per square metre. It appears simple, immediate and objective. Divide the price of a property by its floor area and the result seems to provide a convenient basis for comparison.
But which floor area?
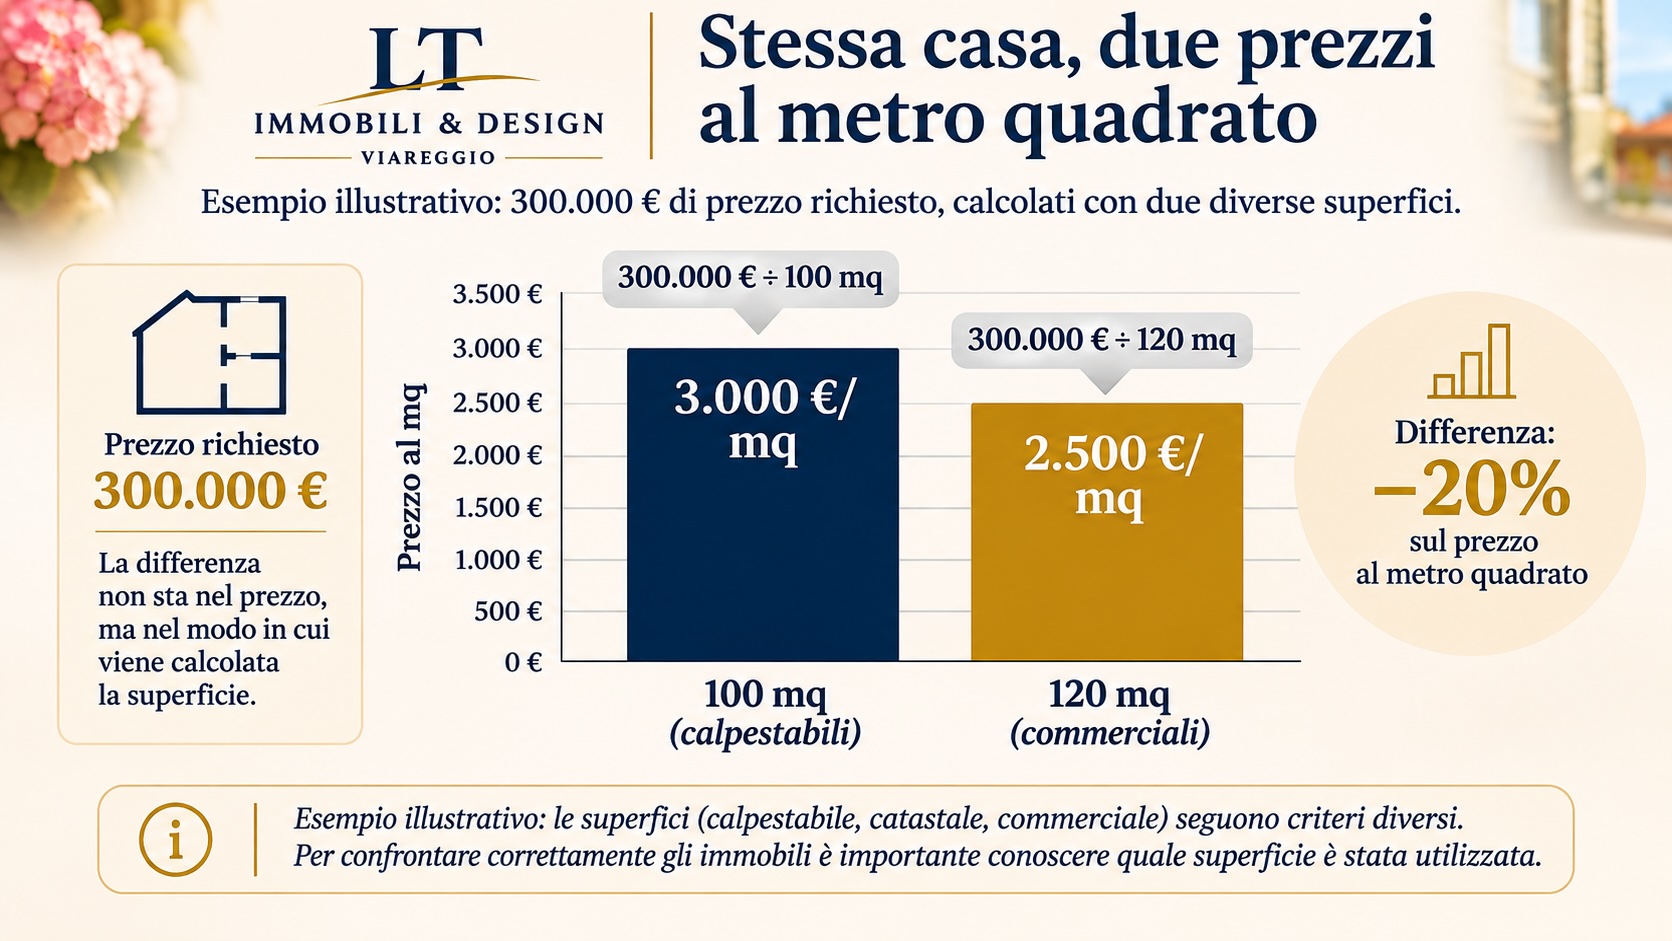
Consider a property offered at €300,000, with 100 square metres of usable internal space and a commercial floor area of 120 square metres.
Calculated using the usable area, the asking price is €3,000 per square metre. Using the commercial area, it becomes €2,500.
The property has not changed. Neither has its asking price. Yet the figure used to describe it is now 20% lower.
This does not mean that one calculation is automatically correct and the other incorrect. Usable floor area, cadastral area and commercial area serve different purposes and may be calculated according to different criteria.
The problem arises when figures based on different definitions are compared as though they were equivalent.
A terrace, a balcony, a garden, an attic or an ancillary room may contribute to a property’s commercial area in ways that vary according to the methodology used. Two homes advertised as having the same floor area may therefore offer very different amounts of actual living space.
A precise figure is not necessarily a comparable figure.
Illustrative example: €300,000 ÷ 100 m² of usable area = €3,000/m²; €300,000 ÷ 120 m² of commercial area = €2,500/m². Difference: −20%.
Automated valuations and the quality of informationAutomated property valuation systems have become increasingly sophisticated. By analysing large quantities of information, they can identify patterns, compare properties and produce estimates within seconds.
These technologies have genuine value. They can offer a useful starting point, reveal broader market tendencies and make information more accessible to people who would otherwise struggle to interpret it.
However, the reliability of an automated estimate depends not only on the quality of the algorithm but also on the quality of the information it receives.
A system working with verified transaction prices, consistent floor-area definitions and detailed property characteristics has a very different foundation from one relying heavily on advertised prices or incomplete descriptions.
Sophisticated models may recognise anomalies, adjust for differences and filter unreliable observations. Even so, there are aspects of a property that are difficult to capture through structured data alone.
The quality of the natural light, the relationship between rooms, the condition of a building, the outlook from a terrace, the atmosphere of a particular street or the practical implications of an unusual layout can all influence how buyers perceive a home.
These characteristics are not always visible in a database.
The question, therefore, is not whether technology should be used. It is how its results should be interpreted, and what additional knowledge is needed to give them meaning.
Institutional data, property portals and local knowledgeIn Italy, several sources contribute to our understanding of the residential market. ISTAT provides statistical information on price movements. The Italian Revenue Agency, through OMI, publishes data and market indicators. The Bank of Italy contributes research into market conditions and expectations.
Property portals offer another valuable perspective: they show what is currently being advertised, how properties are presented and how asking prices evolve over time.
Each source has its strengths, limitations and intended purpose.
For anyone trying to understand a specific property, however, another element remains essential: knowledge of the local market.
A street can make a difference. So can the position of a building within that street, its exposure, its accessibility and the type of buyer most likely to be interested in it.
In coastal areas such as Versilia, distinctions between permanent homes, holiday properties and investment purchases can be particularly significant. Two homes located only a short distance apart may appeal to entirely different audiences.
This is one of the reasons why I consider my work as a local market expert for Borsino Immobiliare an important part of my professional experience. Analysing property values means working with data, but also recognising the circumstances that the data alone cannot fully describe.
The objective is not to replace statistical evidence with personal impressions. It is to bring the two together, understanding where each can contribute and where caution is required.
The value of a home is not a formulaNumbers are indispensable to the property market. Without them, it would be difficult to identify trends, assess opportunities or make informed decisions.
But numbers do not interpret themselves.
A percentage can describe a change without explaining its cause. An average can summarise a market while concealing considerable differences within it. An automated estimate can be mathematically consistent and still fail to capture the characteristics that make a particular property distinctive.
Perhaps the most useful question is not simply how much a home is worth, but how we arrived at that figure.
What information was used? Does it refer to asking prices or completed transactions? Which floor-area definition was applied? How recent are the observations? And how closely do the properties being compared resemble the one we are trying to assess?
These are not merely technical questions. They influence expectations, negotiations and, ultimately, decisions that can have a lasting impact on people’s lives.
The real challenge is not to find a number that appears convincing.
It is to understand where that number comes from, what it represents and how much we can genuinely trust the story it tells.
Giovanni Larini
LT Immobili & Design — Viareggio